Spatial Equity NYC 2022 Report Card
Spatial Equity NYC
2022 Report Card
Table of Contents: Executive Summary | Introduction | Findings | Recommendations
Executive Summary
Transportation Alternatives (TA) and the Civic Data Design Lab at the Norman B. Leventhal Center for Advanced Urbanism at the Massachusetts Institute of Technology (MIT) have uncovered alarming inequities in how public space — including streets, sidewalks, and green spaces — is restricted and distributed in New York City and the harms caused by these policy decisions.
TA’s newest report, Spatial Equity NYC: 2022 Report Card, an outgrowth of Spatial Equity NYC, TA and MIT’s new online data tool, reveals these inequities and ranks dramatic differences between neighborhoods. Spatial Equity NYC is a continuation of NYC 25x25 — TA’s challenge to New York City’s leaders to convert 25 percent of car space into space for people by 2025.
Looking citywide, TA and MIT found that compared to the citywide average:
In City Council districts where the majority of residents are Black, there are 68 percent fewer streets with a protected bike lane, 53 percent fewer bike parking spaces per capita, and a 39 percent higher rate of traffic injuries.
In City Council districts where the majority of residents are Latino, there are 17 percent fewer streets with bus lanes, traffic volumes are 11 percent higher, and buses are 10 percent slower, making bus speeds in majority-Latino districts the slowest buses of any racial or ethnic group in New York City.
In 10 City Council districts with the highest number of residents who are people of color, there are 64 percent fewer streets with protected bike lanes, 49 percent fewer streets with bus lanes, and asthma rates are 51 percent higher.
In the 10 City Council districts with the lowest levels of car ownership, annual traffic volumes are 66 percent higher, and buses are 24 percent slower, meaning residents of these districts disproportionately suffer the harms of car traffic despite not owning cars.
In the 10 City Council districts with the largest Asian populations, there are 60 percent fewer streets with bus lanes and 14 percent fewer streets with protected bike lanes.
Compared to the 10 City Council districts with the largest white populations:
In the 10 City Council districts with the largest populations of people of color, asthma rates are 96 percent higher, there are 83 percent fewer streets with protected bike lanes, 64 percent fewer bike parking spaces, and 57 percent fewer streets with bus lanes, and traffic injury rates are 58 percent higher.
Compared to the 10 City Council districts with the lowest levels of car ownership:
In the 10 City Council districts with the highest car ownership, annual traffic volumes are 141 percent higher, meaning pass-through car traffic disproportionately affects the health, mobility, and environment of districts where few benefit from owning cars.
For some indicators, TA and MIT found especially pronounced inequity:
Asthma: In the 10 City Council districts with the highest asthma rates, 91 percent of residents are people of color, compared to 67 percent citywide. Asthma rates in the worst performing City Council district, District 8 in Manhattan and the Bronx, are 8 times higher than those in the best performing City Council district, District 6 in Manhattan.
Noise Pollution: Noise pollution levels in the worst performing City Council district, District 21 in Queens, are 74 percent higher than in the best performing City Council district, District 27 in Queens.
Traffic Fatalities: Traffic fatalities in the worst performing City Council district, District 28 in Queens, are 2.4 times higher than the citywide average and 9 times higher than traffic fatalities in the best performing City Council district, District 16 in the Bronx.
Traffic Injuries: In the 10 City Council districts with the most traffic injuries, 87 percent of residents are people of color, compared to 67 percent citywide, and there are 42 percent fewer streets with protected bike lanes than the citywide average.
Air Pollution: Compared to the citywide average, in the 10 City Council districts with the highest particulate matter (PM 2.5) air pollution levels, traffic volumes are 50 percent higher and buses are 16 percent slower. PM 2.5 air pollution levels in the worst performing City Council district, District 3 in Manhattan, are 2 times higher than PM 2.5 air pollution levels in the best performing City Council district, City Council District 46 in Brooklyn.
Heat: In the 10 City Council districts with the highest daytime surface temperatures, 91 percent of residents are people of color, compared to 67 percent citywide. In the top three City Council districts with the highest daytime summer temperatures, at least 96 percent of residents are people of color. Majority-Black and Latino districts, as well as the districts with the highest percentages of Asian residents, have higher daytime summer surface temperatures than the citywide average, with majority-Black districts being significantly hotter. Majority-white City Council districts are the only districts where daytime summer surface temperature levels are below the citywide average.
Park Access: In the 10 City Council districts with the least access to parks, 40 percent of residents are Black, compared to 23 percent citywide. In the 10 City Council districts where residents have the most park access, 98 percent of residents live within walking distance to a park (defined as ¼ mile to small park or ½ mile to a large park) while in the 10 City Council districts where residents have the least park access, only 60 percent of residents live in walking distance to a park.
Bus Lanes: There are 10 City Council districts that have zero miles of bus lanes. In District 4 (population 155,199), the single City Council district which has the most streets with bus lanes, there are more miles of bus lanes than in the bottom 25 districts combined (combined population 3.98 million). In the top five City Council districts which have the most streets with bus lanes, 58 percent of residents are white, compared to 33 percent citywide. In districts where more than 10 percent of streets have a bus lane, 70 percent of residents are white.
Bus Speeds: In the 10 City Council districts with the slowest bus speeds, 6 percent of residents drive to work alone, compared to 23 percent citywide, and 77 percent of households are car-free, compared to 54 percent citywide. Of these 10 districts, 10 have higher traffic volumes and nine have higher PM 2.5 air pollution levels than the citywide average. Compared to the citywide average, in the 10 City Council districts with the slowest bus speeds, traffic volumes are 66 percent higher.
Protected Bike Lanes: In majority-Black City Council districts, 1 percent of streets have protected bike lanes; in majority-Latino City Council districts, 2 percent of streets have protected bike lanes; in majority-white City Council districts, 6 percent of streets have protected bike lanes. In District 3 (population 173,254), the single City Council district which has the most streets with protected bike lanes, there are more miles of protected bike lanes than in the bottom 23 districts combined (combined population 3.65 million).
Traffic Volumes: Of the 10 City Council districts with the highest traffic volumes, 10 have slower bus speeds than the citywide average and nine have higher PM 2.5 air pollution levels than the citywide average. Compared to the citywide average, in the 10 City Council districts with the highest traffic volumes, buses are 24 percent slower.
The goal of this report — and the accompanying tool, Spatial Equity NYC — is to empower New Yorkers with data about local disparities in public health, environmental resilience, and mobility that result from how public space is used, and to provide concrete solutions to these inequities that can be implemented quickly on a local level.
Spatial inequity is a systemic problem, the direct result of racist and classist policy decisions. Small-scale, spatial solutions — which are the focus of Spatial Equity NYC — cannot alone solve these systemic issues. However, small-scale, spatial solutions can chip away at the harm caused by systemic racist and classist policies and make immediate and meaningful improvements to the lives of New Yorkers.
To correct these inequities, TA recommends that the City of New York: Convert car space into space that serves more people. The goal should be to convert 25 percent of car space into space for people by 2025, including new parkland, public plazas, expansive tree canopy cover, car-free busways, and protected bike lanes.
TA also calls on all New York City Council members to publicly commit to NYC 25x25 by creating a district-specific plan for converting car space into space for people that directly responds to the spatial inequities faced by their community as laid out on Spatial Equity NYC.
Introduction
Spatial equity is a way to understand how public space — including streets, sidewalks, and green spaces — is distributed, restricted, used, and made unusable, and the different outcomes that result for different communities. Public health, environmental resilience, and human mobility are all affected by how we use public space.
Public space can be used in ways that are uplifting — such as a bus lane that brings workers home to their families faster or a new pocket of parkland that opens up the landscape to boost mental and physical health. But public space can also be used in ways that are devastating — such as a highway that divides communities and exacerbates flooding, excess heat, and air pollutants, burdening residents with the realities of lifelong illness and the threat of traffic violence.
By examining how policy decisions define the use of public space, the burdens or benefits that those decisions may confer, and how those decisions differ across communities, we can map spatial equity, and how it changes with who lives in a neighborhood and their relative power, access, and resources as compared to their neighbors.
Spatial Equity NYC is an online data tool built by Transportation Alternatives and the Massachusetts Institute of Technology that uses publicly available data to document how public space is used in different neighborhoods and how that relates to indicators of public health, environmental resilience, and transportation access. This project is a continuation of NYC 25x25 — TA’s challenge to New York City’s leaders to convert 25 percent of car space into space for people by 2025.
With Spatial Equity NYC, you can see how every City Council and community board district ranks in terms of spatial equity indicators of mobility (including benches, bike parking, bus speeds, bus lanes and busways, protected bike lanes, and traffic density), environmental resilience (including excess heat, park access, surface permeability, and tree canopy), and public health (including asthma rates, air pollution, noise pollution, traffic fatalities, and traffic injuries).
Spatial Equity NYC: 2022 Report Card is the first of many: An annual distillation of those rankings and an analysis of important correlations in spatial equity in New York City and the progress or lack thereof made by New York City leaders to address these inequities.
Findings
Jump to: Public Health | Environment | Mobility
Policies about how public space is used affect public health, environmental resilience, and mobility. These effects are so powerful as to lead to starkly different outcomes even between adjacent districts. TA examined these outcomes and identified significant correlations between race, poverty, and indicators of spatial equity, as well as the worst-performing districts.
CORRELATIONS BETWEEN INDICATORS OF SPATIAL EQUITY
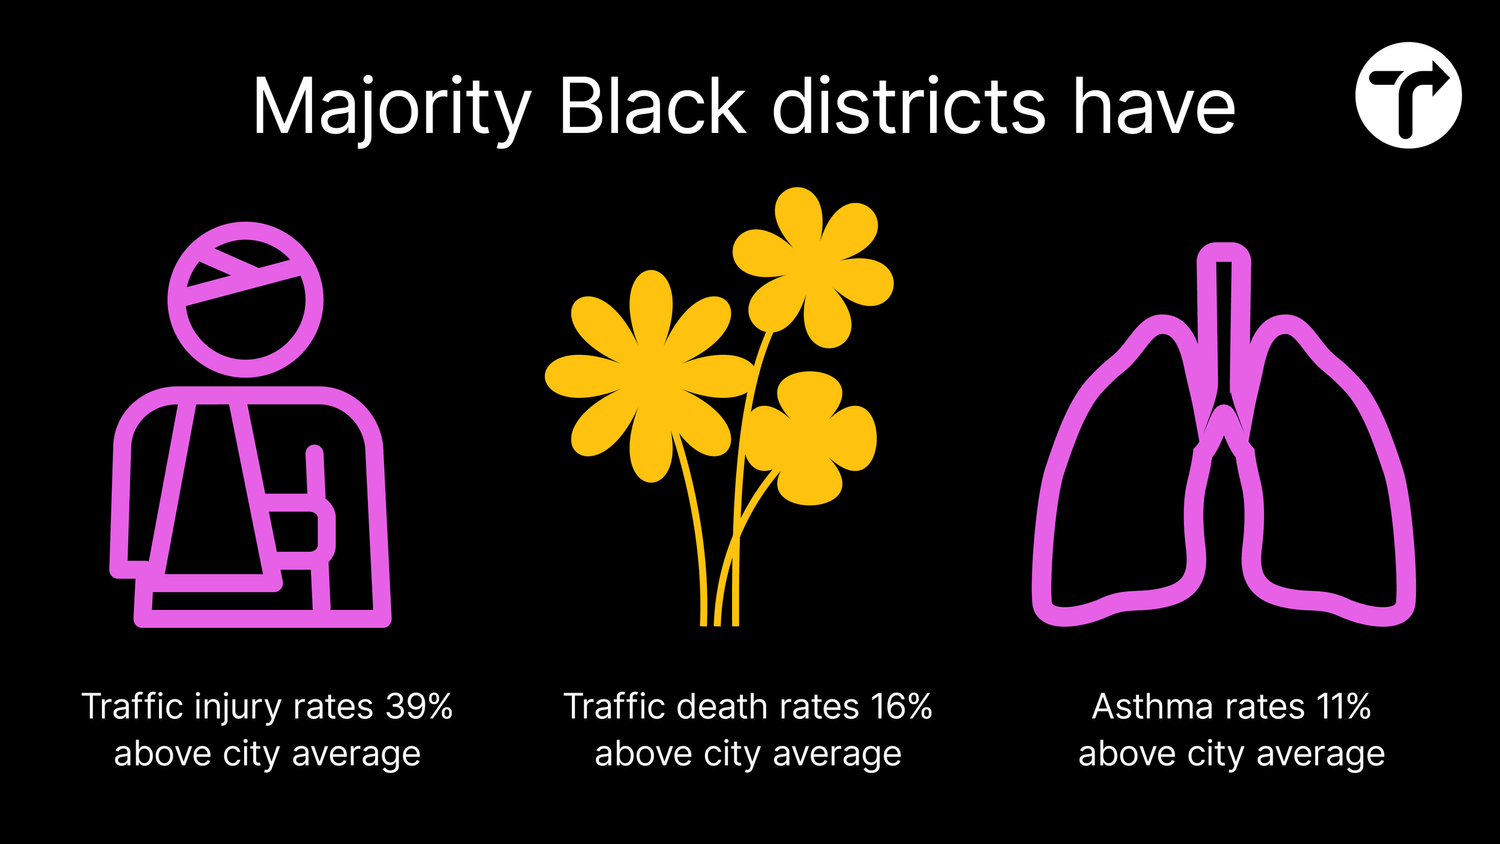
Compared to the citywide average, in City Council districts where the majority of residents are Black:
There are 68 percent fewer streets with protected bike lanes
There are 53 percent fewer bike parking spaces per capita
The rate of traffic injuries is 39 percent higher
The rate of traffic fatalities is 16 percent higher
Adult asthma rates are 11 percent higher
Access to parks is 11 percent lower
Tree canopy cover is 15 percent lower
There are 8 percent fewer benches
Compared to the citywide average, in City Council districts where the majority of residents are Latino:
Adult asthma rates are 40 percent higher
There are 31 fewer streets with protected bike lanes
There are 17 percent fewer streets with bus lanes
Traffic volumes are 11 percent higher
There are 11 percent fewer square feet of permeable surface per block
Buses are 10 percent slower, making bus speeds in majority-Latino districts the slowest buses of any race or ethnicity in New York City
Noise pollution levels are 9 percent louder
There are 8 percent fewer bike parking spaces per capita
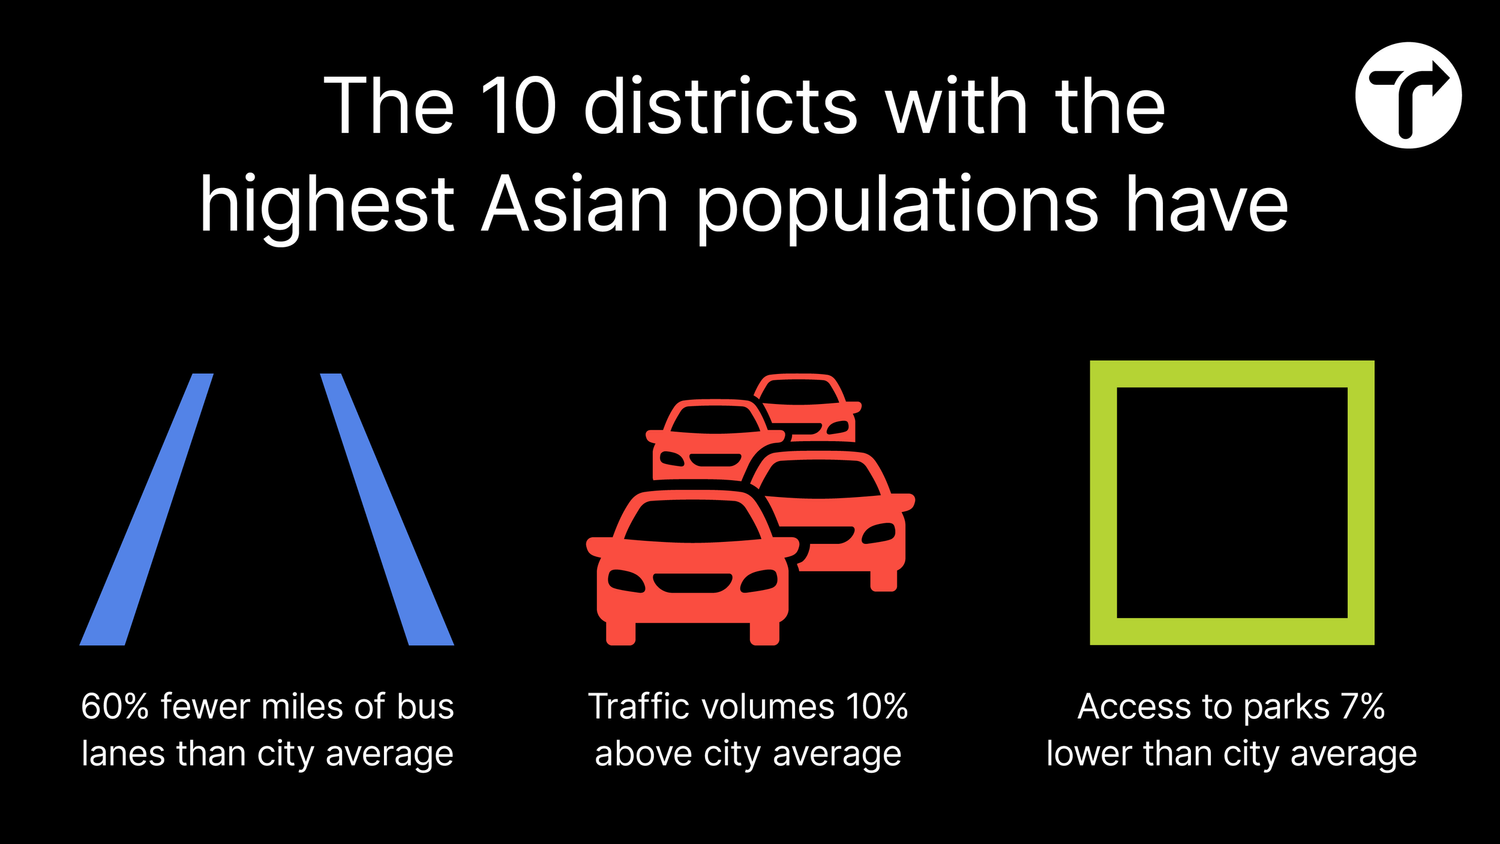
Compared to the citywide average, in the top 10 City Council districts with the largest Asian populations:
There are 60 percent fewer streets with bus lanes
There are 14 percent fewer streets with protected bike lanes
Traffic volumes are 10 percent higher
Access to parks is 7 percent lower

Compared to the 10 City Council districts with the largest white populations, in the 10 City Council districts with the largest populations of people of color:
Asthma rates are 96 percent higher
There are 83 percent fewer streets with protected bike lanes
There are 64 percent fewer bike parking spaces
Traffic injury rates are 58 percent higher
There are 57 percent fewer streets with bus lanes
Traffic fatality rates are 19 percent higher
Compared to the citywide average, in the top 10 City Council districts with the highest percent of households living below the poverty line:
There are 58 percent fewer streets with protected bike lanes
Asthma rates are 53 percent higher
There are 26 percent fewer bike parking spaces
Traffic injury rates are 15 percent higher than the citywide average
Buses are 12 percent slower
Residents bike to work at roughly the same rate, are 22 percent more likely to ride transit, are 30 percent less likely to drive to work, and live in households 57 percent more likely to be car-free
When public space is devoted to car traffic in neighborhoods with low car ownership, residents suffer the harms of car traffic despite not owning cars. In City Council districts where car ownership is low, pass-through car traffic disproportionately affects health, mobility, and environment. Compared to the citywide average, in the top 10 City Council districts with the lowest levels of car ownership:
Annual traffic volumes are 56 percent higher
There are 19 percent fewer square feet of permeable surface per block
Buses are 23 percent slower and at five mph, are only slightly faster than the average human walking speed
Asthma rates are 21 percent higher
PM 2.5 air pollution levels are 11 percent higher
In the top 10 City Council districts with the lowest levels of car ownership, annual traffic volumes are 121 percent higher than the top 10 City Council districts with the highest car ownership.
PUBLIC HEALTH INDICATORS
-
Air pollution generated by car traffic both causes and exacerbates asthma, a chronic lung disease. Asthma interferes with the ability to breathe, exercise, and sleep, and can lead to school and work absences, permanent narrowing of bronchial tubes, and life-threatening attacks requiring hospitalization. More than one in 10 New York children have asthma, a rate that is even higher in low-income Black and Latino neighborhoods. Neighborhoods with larger tree canopies and lower traffic volumes also have lower asthma rates.
The 10 City Council districts with the highest asthma rates in New York City are:
District 8 in the Bronx and Manhattan represented by Council Member Diana Ayala
District 15 in the Bronx represented by Council Member Oswald Feliz
District 16 in the Bronx represented by Council Member Althea Stevens
District 18 in the Bronx represented by Council Member Amanda Farías
District 17 in the Bronx represented by Council Member Rafael Salamanca Jr.
District 10 in Manhattan represented by Council Member Carmen De La Rosa
District 13 in the Bronx represented by Council Member Marjorie Velázquez
District 12 in the Bronx represented by Council Member Kevin Riley
District 14 in the Bronx represented by Council Member Pierina Sanchez
District 41 in Brooklyn represented by Council Member Darlene Mealy
In the 10 City Council districts with the highest asthma rates:
91 percent of residents are people of color, compared to 67 percent citywide
53 percent of residents are Latino, compared to 29 percent citywide
22 percent of households are living below the poverty line, compared to 15 percent citywide
Of the 10 City Council districts with the highest asthma rates:
Nine have fewer bike parking spaces than the citywide average
Eight have higher daytime summer surface temperatures than the citywide average
Eight have slower bus speeds than the citywide average
Eight have less permeable surface area than the citywide average
Compared to the citywide average, in the 10 City Council districts with the highest asthma rates:
There are 44 percent fewer streets with protected bike lanes
There are 33 percent fewer bike parking spaces
Traffic injury rates are 7 percent higher
Noise pollution levels are 7 percent louder
Traffic fatality rates are 5 percent higher
Asthma rates in the worst performing City Council district, District 8 in Manhattan and the Bronx, are 8 times higher than those in the best performing City Council district, District 6 in Manhattan.
-
Exposure to noise pollution increases the risk of heart attack, stroke, dementia, depression, hearing loss, and death. Vehicle traffic causes 80 percent of noise pollution in cities. In parts of Manhattan, the average decibel level reading was as loud as a vacuum cleaner, with peak readings eight times as loud, equivalent to a hand drill. Road noise impacts childhood learning and attention. Nearly 40 percent of New Yorkers experience frequent noise pollution from traffic, with the lowest-income New Yorkers most likely to be affected.from traffic, with the lowest-income New Yorkers most likely to be affected.
The 10 City Council districts with the highest noise pollution levels in New York City are:
District 21 in Queens represented by Council Member Francisco Moya
District 31 in Queens represented by Council Member Selvena Brooks-Powers
District 20 in Queens represented by Council Member Sandra Ung
District 18 in the Bronx represented by Council Member Amanda Farías
District 8 in the Bronx and Manhattan represented by Council Member Diana Ayala
District 38 in Brooklyn represented by Council Member Alexa Avilés (tied with District 50)
District 50 in Staten Island represented by Council Member David Carr (tied with District 38)
District 5 in Manhattan represented by Council Member Julie Menin (tied with District 24)
District 24 in Queens represented by Council Member James Gennaro (tied with District 5)
District 13 in the Bronx represented by Council Member Marjorie Velázquez
In the 10 City Council districts with the highest noise pollution levels:
75 percent of residents are people of color, compared to 67 percent citywide
37 percent of residents are Latino, compared to 29 percent citywide
Of the 10 City Council districts with the highest noise pollution levels:
Nine have fewer bike parking spaces than the citywide average
Eight have fewer streets with bus lanes than the citywide average
Compared to the citywide average, in the 10 City Council districts with the highest noise pollution levels:
There are 29 percent fewer bike parking spaces
There are 18 percent fewer square feet of permeable surface per block
There are 17 percent fewer streets with protected bike lanes
Tree canopy cover is 10 percent lower
Asthma rates are 10 percent higher
Traffic fatality rates are 8 percent higher
Traffic volumes are 5 percent higher
Noise pollution levels in the worst performing City Council district, District 21 in Queens, are 74 percent louder than in the best performing City Council district, District 27 in Queens.
-
Traffic crashes kill about 250 New Yorkers every year. Four in five New York City voters consider traffic violence to be a serious or very serious problem and 70 percent know someone who has been injured or killed. All New Yorkers bear part of this toll, as traffic crashes cost New York City upwards of $4.29 billion yearly in property destruction, insurance premiums, taxes, and travel delays.
The 10 City Council districts with the highest rate of traffic fatalities in the city from 2014 to 2022 were:
District 28 in Queens represented by Council Member Adrienne Adams
District 46 in Brooklyn represented by Council Member Mercedes Narcisse
District 17 in the Bronx represented by Council Member Rafael Salamanca Jr.
District 42 in Brooklyn represented by Council Member Charles Barron
District 23 in Queens represented by Council Member Linda Lee
District 4 in Manhattan represented by Council Member Keith Powers
District 3 in Manhattan represented by Council Member Erik Bottcher
District 13 in the Bronx represented by Council Member Marjorie Velázquez (tied with District 45)
District 45 in Brooklyn represented by Council Member Farah Louis (tied with District 13)
District 8 in the Bronx and Manhattan represented by Council Member Diana Ayala
In the 10 City Council districts with the most traffic fatalities 32 percent of residents are Black, compared to 23 percent citywide.
Of the 10 City Council districts with the most traffic fatalities:
Nine have fewer square feet of permeable surface per block than the citywide average
Eight have more traffic injuries than the citywide average
Eight have hotter daytime surface temperatures than the citywide average
Eight have less tree canopy cover than the citywide average
Eight have fewer bike parking spaces than the citywide average
Compared to the citywide average, in the 10 City Council districts with the highest rate of traffic fatalities:
Traffic injury rates are 29 percent higher
There are 15 percent fewer square feet of permeable surfaces per block
Tree canopy cover is 13 percent lower
There are 5 percent fewer benches
Traffic fatalities in the worst performing City Council district, City Council District 28 in the Bronx, are 9 times higher than traffic fatalities in the best performing City Council district, City Council District 16 in the Bronx and 2.4 times higher than the citywide average.
-
Traffic crashes injure about 55,000 New Yorkers annually. One in 10 pedestrian and cyclist injuries is severe, including brain damage, dismemberment, and paralyzation. Traffic crashes are the single leading cause of post-traumatic stress disorder in the general population. Nearly half of people involved in a traffic crash develop PTSD, while 70 percent report an extreme impact on work or schooling. New Yorkers living in low-income neighborhoods are more likely to be injured in traffic crashes, a result of inequitable street design.
The 10 City Council districts with the highest numbers of traffic injuries in the city from 2014 to 2022 were:
District 42 in Brooklyn represented by Council Member Charles Barron
District 28 in Queens represented by Council Member Adrienne Adams
District 45 in Brooklyn represented by Council Member Farah Louis
District 27 in Queens represented by Council Member Nantasha Williams
District 8 in the Bronx and Manhattan represented by Council Member Diana Ayala
District 41 in Brooklyn represented by Council Member Darlene Mealy
District 31 in Queens represented by Council Member Selvena Brooks-Powers
District 17 in the Bronx represented by Council Member Rafael Salamanca Jr.
District 37 in Brooklyn represented by Council Member Sandy Nurse
District 33 in Brooklyn represented by Council Member Lincoln Restler
In the 10 City Council districts with the most traffic injuries:
87 percent of residents are people of color, compared to 67 percent citywide
51 percent of residents are Black, compared to 23 percent citywide
Of the 10 City Council districts with the most traffic injuries:
All 10 have less tree canopy cover than the citywide average
Nine have hotter daytime summer surface temperatures than the citywide average
Nine have fewer bike parking spaces than the citywide average
Compared to the citywide average, in the 10 City Council districts with the most traffic injuries:
There are 42 percent fewer streets with protected bike lanes
Traffic fatalities rates are 33 percent higher
Tree canopy cover is 24 percent lower
There are 16 percent fewer bike parking spaces
There are 10 percent fewer streets with bus lanes
ENVIRONMENTAL INDICATORS
-
Particulate matter air pollution (PM 2.5), the most harmful urban air pollutant, is predominantly produced by vehicles and causes shortness of breath, asthma, lung disease, and premature death. Conservative estimates count PM 2.5 air pollution as the cause of at least five percent of New Yorkers’ deaths and the cause of hospitalization for at least 6,300 New Yorkers annually. New York neighborhoods with higher traffic density have higher levels of PM 2.5.
The 10 City Council districts with the highest levels of PM 2.5 air pollution in the city are:
District 3 in Manhattan represented by Council Member Erik Bottcher
District 4 in Manhattan represented by Council Member Keith Powers
District 2 in Manhattan represented by Council Member Carlina Rivera
District 5 in Manhattan represented by Council Member Julie Menin
District 33 in Brooklyn represented by Council Member Lincoln Restler
District 1 in Manhattan represented by Council Member Christopher Marte
District 6 in Manhattan represented by Council Member Gale Brewer (tied with District 25)
District 25 in Queens represented by Council Member Shekar Krishnan (tied with District 6)
District 21 in Queens represented by Council Member Francisco Moya (tied with District 34)
District 34 in Brooklyn represented by Council Member Jennifer Gutiérrez (tied with District 21)
In the 10 City Council districts with the highest levels of PM 2.5 air pollution, 70 percent of households are car-free, compared to 55 percent citywide.
Of the 10 City Council districts with the highest levels of PM 2.5 air pollution:
Nine have less tree canopy cover than the citywide average
Nine have higher traffic volumes than the citywide average
Eight have slower bus speeds than the citywide average
Compared to the citywide average, in the 10 City Council districts with the most PM 2.5 air pollution:
Traffic volumes are 50 percent higher
There is 16 percent less tree canopy cover
Buses are 16 percent slower
Noise pollution levels are 6 percent louder
PM 2.5 air pollution levels in the worst performing City Council district, City Council District 3 in Manhattan, are 2 times higher than PM 2.5 air pollution levels in the best performing City Council district, City Council District 46 in Brooklyn.
In 47 of New York City’s 51 City Council districts, PM 2.5 air pollution levels are above the World Health Organization’s guidelines for acceptable levels of air pollution.
-
Exposure to excessive higher-than-average temperatures can lead to heatstroke, asthma attacks, cardiovascular collapse, kidney failure, permanent disability, and death. Neighborhood heat is exacerbated by greater areas of road space and higher traffic density, while shade and green space reduce heat. In New York City, low-income and Black neighborhoods are as much as 13 degrees hotter than other neighborhoods. Low-income, Black, and older New Yorkers are much more likely to suffer heat-related deaths.
The 10 City Council districts with the highest daytime summer surface temperatures in the city are:
District 27 in Queens represented by Council Member Nantasha Williams
District 28 in Queens represented by Council Member Adrienne Adams
District 21 in Queens represented by Council Member Francisco Moya
District 20 in Queens represented by Council Member Sandra Ung
District 24 in Queens represented by Council Member James Gennaro
District 42 in Brooklyn represented by Council Member Charles Barron
District 17 in the Bronx represented by Council Member Rafael Salamanca Jr.
District 25 in Queens represented by Council Member Shekar Krishnan
District 37 in Brooklyn represented by Council Member Sandy Nurse
District 45 in Brooklyn represented by Council Member Farah Louis
In the 10 City Council districts with the highest daytime surface temperatures:
91 percent of residents are people of color, compared to 67 percent citywide
35 percent of residents are Black, compared to 23 percent citywide
34 percent of residents are Latino, compared to 29 percent citywide
Of the 10 City Council districts with the highest daytime surface temperatures:
All 10 have fewer bike parking spaces than the citywide average
Nine have fewer protected bike lanes than the citywide average
Eight have less tree canopy cover than the citywide average
Compared to the citywide average, in the 10 City Council districts with the highest daytime summer surface temperatures:
There are 63 percent fewer streets with protected bike lanes
There are 43 percent fewer bike parking spaces
There are 27 percent fewer streets with bus lanes
Traffic injury rates are 24 percent higher
Traffic fatality rates are 20 percent higher
There is 17 percent less tree canopy cover
There are 15 percent fewer benches
Park access is 7 percent lower
In the top three City Council districts with the highest daytime summer temperatures, 96 percent or more of residents are people of color.
All of the top 10 City Council districts with the highest daytime summer surface temperatures are home to a greater percentage of people of color than the citywide average. Majority-Black and Latino districts, as well as the districts with the highest percentages of Asian residents, have higher daytime summer surface temperatures than the citywide average, with majority-Black districts being significantly hotter. Majority-white City Council districts are the only districts where daytime summer surface temperature levels are below the citywide average. Of the 16 majority-white districts, 14 are cooler than the citywide average (88 percent); this is only true for 3 of the 10 majority-Black districts (30 percent).
In the 10 City Council districts with the highest daytime summer surface temperatures, residents are half as likely to walk to work and 64 percent less likely to bike to work than residents of the 10 City Council districts with the lowest daytime summer surface temperatures.
-
Parks mitigate air pollution and flooding, reduce air and surface temperatures, and improve the mental and physical health of people who live in their proximity. One in five New Yorkers do not live within walking distance of a park (defined as ¼ mile to a small park or ½ mile to a large park). On average, New York City parks in low-income neighborhoods are 54 percent smaller than parks in wealthy neighborhoods, and parks in neighborhoods with more Black residents are 73 percent smaller than parks with more white residents.
The 10 City Council districts with the least access to parks in the city are:
District 23 in Queens represented by Council Member Linda Lee
District 12 in the Bronx represented by Council Member Kevin Riley
District 22 in Queens represented by Council Member Tiffany Cabán
District 51 in Staten Island represented by Council Member Joseph Borelli
District 50 in Staten Island represented by Council Member David Carr
District 31 in Queens represented by Council Member Selvena Brooks-Powers
District 27 in Queens represented by Council Member Nantasha Williams
District 49 in Staten Island represented by Council Member Kamillah Hanks
District 40 in Brooklyn represented by Council Member Rita Joseph
District 45 in Brooklyn represented by Council Member Farah Louis
In the 10 City Council districts with the least access to parks, 40 percent of residents are Black, compared to 23 percent citywide.
Of the 10 City Council districts with the least access to parks:
Nine have more traffic fatalities than the citywide average
Eight have less permeable surfacing than the citywide average
Compared to the citywide average, in the 10 City Council districts with the least park access:
There are 61 percent fewer streets with protected bike lanes
There are 53 percent fewer bike parking spaces
There are 45 percent fewer square feet of permeable surface per block
There are 31 percent fewer benches
There are 27 percent fewer streets with bus lanes
Traffic injury rates are 6 percent higher
In the 10 City Council districts where residents have the most park access, 98 percent of residents live within walking distance to a park while in the 10 City Council districts where residents have the least park access, only 60 percent of residents live within walking distance to a park.
-
Asphalt and concrete are impermeable surfaces that make districts more prone to stormwater flooding, risking the spread of disease, wastewater, and pollution runoff infiltrating waterways, and death from drowning. About 72 percent of New York City’s surface is impermeable. For every one percent expansion of asphalt and concrete surfaces, annual flood risk increases over three percent. Low-income, non-white, and disabled New Yorkers are more vulnerable to the effects of extreme flooding.
The 10 City Council districts with the fewest square feet of permeable surface per block are:
District 48 in Brooklyn represented by Council Member Inna Vernikov
District 5 in Manhattan represented by Council Member Julie Menin
District 14 in the Bronx represented by Council Member Pierina Sanchez
District 10 in Manhattan represented by Council Member Carmen De La Rosa
District 7 in Manhattan represented by Council Member Shaun Abreu
District 49 in Staten Island represented by Council Member Kamillah Hanks
District 4 in Manhattan represented by Council Member Keith Powers
District 27 in Queens represented by Council Member Nantasha Williams
District 46 in Brooklyn represented by Council Member Mercedes Narcisse
District 6 in Manhattan represented by Council Member Gale Brewer
Of the 10 City Council districts with the fewest square feet of permeable surfaces per block:
Seven have fewer streets with protected bike lanes than the citywide average
Seven have fewer streets with bus lanes than the citywide average
Seven have slower bus speeds than the citywide average
Compared to the citywide average, in the 10 City Council districts with the fewest square feet of permeable surface per block:
Traffic volumes are 23 percent higher
There are 12 percent fewer bike parking spaces
Buses are 7 percent slower
Traffic fatality rates are 5 percent higher
-
Districts with fewer trees are hotter, more polluted, more flood-prone, and have higher rates of heat-related mortality. Trees remove pollution from the air, lower the air temperature, increase ground permeability, mitigate flooding, and help keep stormwater runoff and street pollution out of waterways. In New York City, neighborhoods with the least tree canopy coverage are more likely to be lower-income communities of color.
The 10 City Council districts with the least tree canopy cover in the city are:
District 3 in Manhattan represented by Council Member Erik Bottcher
District 26 in Queens represented by Council Member Julie Won
District 34 in Brooklyn represented by Council Member Jennifer Gutiérrez
District 31 in Queens represented by Council Member Selvena Brooks-Powers
District 47 in Brooklyn represented by Council Member Ari Kagan
District 32 in Queens represented by Council Member Joann Ariola
District 17 in the Bronx represented by Council Member Rafael Salamanca Jr.
District 42 in Brooklyn represented by Council Member Charles Barron
District 4 in Manhattan represented by Council Member Keith Powers
District 28 in Queens represented by Council Member Adrienne Adams
Of the 10 City Council districts with the least tree canopy cover:
Nine have more traffic fatalities than the citywide average
Eight have less permeable surface area than the citywide average
Compared to the citywide average, in the 10 City Council districts with the least tree canopy cover:
Traffic fatality rates are 42 percent higher
Traffic injury rates are 21 higher
There are 9 percent fewer square feet of permeable surfaces per block
PM 2.5 air pollution levels are 6 percent higher
MOBILITY INDICATORS
-
As of 2020, there was only one bicycle parking space for every 116 bicycles in New York City. As a result, over one in four New York households and more than half of delivery workers have reported losing a bike to theft. New Yorkers rank bike parking as the second most important factor in deciding whether to commute by bicycle. Low-income and non-white New Yorkers are less likely to live or work in buildings that offer bicycle storage, and more likely to ride the types of bicycles that are stolen the most often.
The 10 City Council districts with the fewest bike parking spaces in the city are:
District 31 in Queens represented by Council Member Selvena Brooks-Powers
District 12 in the Bronx represented by Council Member Kevin Riley
District 51 in Staten Island represented by Council Member Joseph Borelli
District 50 in Staten Island represented by Council Member David Carr
District 27 in Queens represented by Council Member Nantasha Williams
District 24 in Queens represented by Council Member James Gennaro
District 28 in Queens represented by Council Member Adrienne Adams
District 41 in Brooklyn represented by Council Member Darlene Mealy
District 49 in Staten Island represented by Council Member Kamillah Hanks
District 30 in Queens represented by Council Member Robert Holden
In the 10 City Council districts with the fewest bike parking spaces:
38 percent of residents are Black, compared to 23 percent citywide
In the 10 City Council districts with the most bike parking spaces:
49 percent of residents are white, compared to 33 percent citywide
9 percent of residents are Black, compared to 23 percent citywide
Of the 10 City Council districts with the fewest bike parking spaces:
All 10 have fewer streets with protected bike lanes than the citywide average
Nine have less access to parks than the citywide average
Nine have fewer streets with bus lanes than the citywide average
Nine have fewer benches than the citywide average
Compared to the citywide average, in the 10 City Council districts with the fewest bike parking spaces:
There are 72 percent fewer streets with bike lanes
There are 49 percent fewer streets with bus lanes
There are 44 percent fewer benches
Park access is 18 percent lower
Traffic injury rates are 16 percent higher
Traffic fatalities rates are 9 percent higher
In New York City, per capita, there are:
38 bike parking spaces in majority-Black City Council districts
74 bike parking spaces in majority-Latino City Council districts
78 bike parking spaces in the 10 districts with the largest Asian population
108 bike parking spaces in majority-white City Council districts
-
Busways and bus lanes increase bus speeds, reduce crashes, increase bus ridership, reduce car use and reduce travel times without impacting traffic volume or speed. Three out of four New Yorkers who rely on the bus are low-income. Compared to the average New Yorker, bus riders in New York City are less likely to have a bachelor’s degree and more likely to be a single parent, be foreign-born, be a person of color, and have a child at home.
For bus lanes, inequities are so severe that ranking the worst 10 list is moot. This includes the 10 City Council districts which have zero miles of bus lanes in the city, which are:
District 12 in the Bronx represented by Council Member Kevin Riley
District 19 in Queens represented by Council Member Vickie Paladino
District 21 in Queens represented by Council Member Francisco Moya
District 22 in Queens represented by Council Member Tiffany Cabán
District 26 in Queens represented by Council Member Julie Won
District 28 in Queens represented by Council Member Adrienne Adams
District 34 in Brooklyn represented by Council Member Jennifer Gutiérrez
District 37 in Brooklyn represented by Council Member Sandy Nurse
District 38 in Brooklyn represented by Council Member Alexa Avilés
District 43 in Brooklyn represented by Council Member Justin Brannan
Of the 10 City Council districts with zero miles of bus lanes:
Eight have less tree canopy cover than the citywide average
Eight have fewer streets with protected bike lanes than the citywide average
Compared to the citywide average, in the 10 City Council districts with zero miles bus lanes:
There are 49 percent fewer streets with protected bike lanes
There is 22 percent less tree canopy cover
Noise pollution levels are 7 percent louder
Traffic fatality rates are 5 percent higher
Traffic injury rates are 5 percent higher
In the single City Council district (population 155,199) which has the most miles of bus lanes, there are more miles of bus lanes than in the bottom 25 districts combined (combined population 3.98 million).
In the top five City Council districts which have the most streets with bus lanes, 56 percent of residents are white, compared to 33 percent citywide. In districts where more than 10 percent of streets have a bus lane, 70 percent of residents are white.
Of the 10 districts with zero miles of bus lanes, buses are slowest in District 7 in Manhattan at an average of 5 mph.
In New York City, there are bus lanes on:
1 percent of streets have bus lanes in the 10 districts with the largest Asian population
3 percent of streets in majority-Black City Council districts
3 percent of streets in majority-Latino City Council districts
5 percent of streets in majority-white City Council districts
-
New York City buses are the slowest in the nation, averaging less than eight miles per hour, a result of a density of private car and truck traffic and a lack of exclusive bus routes. More than one in three New York City bus riders spends an hour or more commuting and lacks alternatives like subways or protected bike lanes. New Yorkers who rely on the bus are more likely than the average New Yorker to be low-income and people of color.
The 10 City Council districts with the slowest bus speeds in the city are:
District 3 in Manhattan represented by Council Member Erik Bottcher
District 1 in Manhattan represented by Council Member Christopher Marte (tied with Districts 2 and 6)
District 2 in Manhattan represented by Council Member Carlina Rivera (tied with Districts 1 and 6)
District 6 in Manhattan represented by Council Member Gale Brewer (tied with Districts 1 and 2)
District 4 in Manhattan represented by Council Member Keith Powers (tied with District 5)
District 5 in Manhattan represented by Council Member Julie Menin (tied with District 4)
District 9 in Manhattan represented by Council Member Kristin Richardson Jordan
District 7 in Manhattan represented by Council Member Shaun Abreu
District 8 in the Bronx and Manhattan represented by Council Member Diana Ayala
District 10 in Manhattan represented by Council Member Carmen De La Rosa
In the 10 City Council districts with the slowest bus speeds:
6 percent of residents drive to work alone, compared to 23 percent citywide
77 percent of households are car-free, compared to 55 percent citywide
Of the 10 City Council districts with the slowest bus speeds:
Ten have higher traffic volumes than the citywide average
Nine have higher PM 2.5 air pollution levels than the citywide average
Eight have less permeable surface area than the citywide average
Compared to the citywide average, in the 10 City Council districts with the slowest bus speeds:
Traffic volumes are 66 percent higher
There are 24 percent fewer square feet of permeable surfaces per block
Asthma rates are 15 percent higher
PM 2.5 air pollution levels are 13 percent higher
-
Nine out of 10 cyclist fatalities in New York City occur on streets without dedicated space for bicycles. Black, Latino, and Asian New Yorkers are disproportionately killed while riding bikes. New Yorkers who are killed on bicycles are, on average, less educated and more likely to be foreign-born than the average New Yorker on a bicycle. More than 70 percent of New Yorkers killed while biking reside in or adjacent to the district where the crash occurred.
The 10 City Council districts which have the fewest streets with protected bike lanes in the city are:
District 14 in the Bronx represented by Council Member Pierina Sanchez (tied with Districts 18, 27, 28, 36, 44, and 45)
District 18 in the Bronx represented by Council Member Amanda Farías (tied with Districts 14, 27, 28, 36, 44, and 45)
District 27 in Queens represented by Council Member Nantasha Williams (tied with Districts 14, 18, 28, 36, 44, and 45)
District 28 in Queens represented by Council Member Adrienne Adams (tied with Districts 14, 18, 27, 36, 44, and 45)
District 36 in Brooklyn represented by Council Member Chi Ossé (tied with Districts 14, 18, 27, 28, 44, and 45)
District 44 in Brooklyn represented by Council Member Kalman Yeger (tied with Districts 14, 18, 27, 28, 36, and 45)
District 45 in Brooklyn represented by Council Member Farah Louis (tied with Districts 14, 18, 27, 28, 36, and 44)
District 24 in Queens represented by Council Member James Gennaro
District 50 in Staten Island represented by Council Member David Carr
District 19 in Queens represented by Council Member Vickie Paladino
In the 10 City Council districts which have the fewest streets with protected bike lanes:
74 percent of residents are people of color, compared to 67 percent citywide
34 percent of residents are Black, compared to 23 percent citywide
Of the 10 City Council districts which have the fewest streets with protected bike lanes:
All 10 have fewer bike parking spaces than the citywide average
Eight have less park access than the citywide average
Eight have fewer benches than the citywide average
Compared to the citywide average, in the 10 City Council districts which have the fewest streets with protected bike lanes:
There are 45 percent fewer bike parking spaces
There are 24 percent fewer benches
There are 19 percent fewer square feet of permeable surfaces per block
There are 16 percent fewer streets with bus lanes
Traffic injury rates are 13 percent higher
Park access is 7 percent lower
Traffic fatalities rates are 7 percent higher
In New York City, there are protected bike lanes on:
1 percent of streets in majority-Black City Council districts
2 percent of streets in majority-Latino City Council districts
3 percent of streets in the 10 districts with the largest Asian population
6 percent of streets in majority-white City Council districts
In the single City Council district (population 173,254) which has the most miles of protected bike lanes, there are more miles of protected bike lanes than in the bottom 23 districts combined (combined population 3.65 million).
-
There are only around 2,100 on-street benches in New York City, approximately one bench for every 4,200 New Yorkers. Essential to an accessible city, on-street seating facilitates social activity, increases street presence, and enables people to stay outdoors for longer periods. Benches also serve as mobility aids, so districts that lack on-street seating pose a danger to the estimated 550,000 New Yorkers who have difficulty walking.
The 10 City Council districts with the fewest benches in the city are:
District 51 in Staten Island represented by Council Member Joseph Borelli
District 24 in Queens represented by Council Member James Gennaro
District 12 in the Bronx represented by Council Member Kevin Riley
District 23 in Queens represented by Council Member Linda Lee
District 28 in Queens represented by Council Member Adrienne Adams
District 20 in Queens represented by Council Member Sandra Ung
District 50 in Staten Island represented by Council Member David Carr
District 18 in the Bronx represented by Council Member Amanda Farías
District 49 in Staten Island represented by Council Member Kamillah Hanks
District 30 in Queens represented by Council Member Robert Holden
Of the 10 City Council districts with the fewest benches:
All 10 have less park access than the citywide average
All 10 have fewer bike parking spaces than the citywide average
All 10 have fewer streets with bus lanes than the citywide average
All 10 have fewer streets with bike lanes than the citywide average
Compared to the citywide average, in the 10 City Council districts with the fewest benches:
There are 69 percent fewer streets with protected bike lanes
There are 59 percent fewer bike parking spaces
There are 58 percent fewer streets with bus lanes
Park access is 18 lower
Traffic fatality rates are 17 higher
Noise pollution levels are 9 percent louder
There are 8 percent fewer square feet of permeable surfaces per block
-
The volume of cars and trucks on a street or passing through a neighborhood directly amplifies the harm caused by traffic, such as air pollution, noise pollution, asthma, excess heat, injury, and death. Fewer than half of New York households own a car, but three-quarters of total street space is given to motor vehicles, including three million free on-street parking spots. In New York City, traffic-related harms, including air pollution, asthma, and excess heat, are significantly worse in low-income neighborhoods and neighborhoods of color.
The 10 City Council districts with the highest traffic volumes in the city are:
District 5 in Manhattan represented by Council Member Julie Menin
District 4 in Manhattan represented by Council Member Keith Powers
District 2 in Manhattan represented by Council Member Carlina Rivera
District 6 in Manhattan represented by Council Member Gale Brewer
District 7 in Manhattan represented by Council Member Shaun Abreu
District 3 in Manhattan represented by Council Member Erik Bottcher
District 10 in Manhattan represented by Council Member Carmen De La Rosa
District 8 in the Bronx and Manhattan represented by Council Member Diana Ayala
District 1 in Manhattan represented by Council Member Christopher Marte
District 9 in Manhattan represented by Council Member Kristin Richardson Jordan
In the 10 City Council districts with the highest traffic volumes:
78 percent of households are car-free, compared to 55 percent citywide
77 percent of commuter bike, walk, or ride public transit, compared to 63 percent of commuters citywide
19 percent of commuter walk to work, compared to 10 percent citywide
Of the 10 City Council districts with the highest traffic volumes:
All 10 have slower bus speeds than the citywide average
Nine have higher PM 2.5 air pollution levels than the citywide average
Eight have less permeable surface area than the citywide average
Compared to the citywide average, in the 10 City Council districts with the highest traffic volumes:
Buses are 24 percent slower
There are 24 percent fewer square feet of permeable surface per block
Asthma rates are 15 percent higher
PM 2.5 air pollution levels are 13 percent higher
Recommendations
In New York City, streets and sidewalks make up the majority of public spaces — and the overwhelming majority of this space (76 percent) is devoted to parking and moving cars. Devoting so much of New York City’s finite public space to car traffic has created widespread and deeply inequitable harms, especially to already vulnerable populations.
To correct these inequities, TA recommends that the City of New York convert car space into space that serves more people. This starts with converting 25 percent of car space into space for people by 2025, including new parkland, public plazas with seating, expansive tree canopy cover, car-free busways, and protected bike lanes — prioritized in communities that have borne the brunt of historic disinvestment and racist planning.
In addition, TA is calling on all City Council members to visit Spatial Equity NYC to learn the three indicators where their district experiences the worst inequities in New York City, and then publicly commit to creating a district-specific plan that converts car space into space for people in a way that directly responds to each of these inequities. (Spatial Equity NYC lays out these solutions.)
Spatial inequity is a systemic problem, the direct result of decades of racist and classist policy decisions. Small-scale, spatial solutions cannot alone solve these systemic issues. However, spatial solutions can make immediate and meaningful improvements to the lives of New Yorkers. These changes can be large and small.
On the smallest scale, by reclaiming parking spaces, the City of New York can:
Install curb extensions that calm traffic and reduce traffic fatalities
Create ample tree canopies that reduce excess heat, clean the air, and expand flood-resilient land
Build plazas that make whole neighborhoods more accessible for people walking and riding the bus
On the largest scale, by tearing down highways and closing streets to car traffic, the City of New York can:
Build expedient car-free busways and safe protected bike lanes that shift trips out of cars
Speed bus trips
Boost bicycling rates
Reduce traffic fatalities, traffic injuries, asthma, noise pollution, and air pollution
For more detailed and specific solutions, the Spatial Equity NYC data tool includes 45 detailed and evidenced-based ideas that respond to every indicator spatial equity outlined in this report card.
By giving a meaningful percentage of the street back to people, the City of New York could save lives, improve air quality, build climate resilience into every roadbed, and set the tone for the future of New York as a vibrant and fair city with accessible, efficient transportation and robust, thriving street culture.
While this change would be a wholesale transformation of New York City, there are also specific and locally applicable recommendations that respond to the indicators of spatial equity laid out in this report card. These concrete solutions can be implemented quickly on a local level.
The width of a street, the presence of a bench, or the size of a park affects the health, accessibility, and resilience of any given community. Where a wide street means more traffic fatalities and more pollution, a narrow road can mean safer street crossings, cleaner air, and easier access to outdoor recreation — and as a result, improved outcomes in health, education, economic opportunity, and quality of life. The way that public space is used is the result of policy decisions that too often lead to inequities in public health, infrastructure access, and the environment. We must use public space to correct these harms.